Finds the critical path from a dataframe with predecessor and successor
- view interactive network created from this script here
In [ ]:
import networkx as nx
import pandas as pd
from pyvis.network import Network
In [ ]:
# Create a DataFrame
data = {
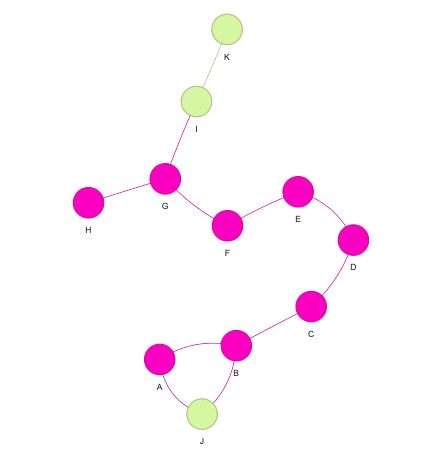
'predecessor': ['A', 'B', 'C', 'D', 'E', 'F', 'G', 'A', 'B', 'G', 'I'],
'successor': ['B', 'C', 'D', 'E', 'F', 'G', 'H', 'J', 'J', 'I', 'K'],
'duration': [5, 3, 2, 4, 7, 6, 8, 4, 1, 1, 1],
'color': ['#FF00CC', '#FF00CC', '#FF00CC', '#FF00CC', '#FF00CC', '#FF00CC', '#FF00CC','#DAF7A6', '#FF00CC', '#DAF7A6', '#DAF7A6']
}
df = pd.DataFrame(data)
df.head()
Out[ ]:
| predecessor | successor | duration | color | |
|---|---|---|---|---|
| 0 | A | B | 5 | #FF00CC |
| 1 | B | C | 3 | #FF00CC |
| 2 | C | D | 2 | #FF00CC |
| 3 | D | E | 4 | #FF00CC |
| 4 | E | F | 7 | #FF00CC |
In [ ]:
# Create a NetworkX DiGraph
G = nx.DiGraph()
In [ ]:
# Iterate through the DataFrame and add edges to the graph
for index, row in df.iterrows():
    G.add_edge(row['predecessor'], row['successor'], duration=row['duration'])
In [ ]:
# Find the critical path
critical_path = nx.dag_longest_path(G, weight='duration')
print(f'Critical Path: {critical_path}')
Critical Path: ['A', 'B', 'C', 'D', 'E', 'F', 'G', 'H']
In [ ]:
# Calculate the total duration of the critical path
total_duration = sum(G[u][v]['duration'] for u, v in zip(critical_path, critical_path[1:]))
print(f'Total Duration of Critical Path: {total_duration}')
Total Duration of Critical Path: 35
In [ ]:
net = Network('500px', '800px', notebook=True)
Warning: When cdn_resources is 'local' jupyter notebook has issues displaying graphics on chrome/safari. Use cdn_resources='in_line' or cdn_resources='remote' if you have issues viewing graphics in a notebook.
In [ ]:
# Add nodes with custom colors based on the DataFrame
for node in G.nodes():
    # Find the color associated with the node
    color = df.loc[df['predecessor'] == node, 'color']
    if color.empty:
        color = df.loc[df['successor'] == node, 'color']
    color = color.values[0] if not color.empty else 'gray'  # Default to gray if no color found
    net.add_node(node, color=color)
In [ ]:
# Plot with pyvis

# net.show_buttons() # Show part 3 in the plot (optional)
net.from_nx(G) # Create directly from nx graph
net.show('criticalpath.html')
criticalpath.html
Out[ ]: